K Nearest Neighbors-Effect of parameters on output
K Nearest Neighbors Analyses technique is tested here to see their accuracy in terms of output.
Python program:
//Plotting the analysis//
a) Effect of weights:
>>> for weights in ['uniform', 'distance']:
... clf = neighbors.KNeighborsClassifier(n_neighbors, weights=weights)
... clf.fit(x, y)
... x_min, x_max = x[:, 0].min() -1, x[:, 0].max() +1
... y_min, y_max = x[:, 1].min() -1, x[:, 1].max() +1
... xx, yy = np.meshgrid(np.arange(x_min, x_max, h), np.arange(y_min, y_max, h))
... z = clf.predict(np.c_[xx.ravel(), yy.ravel()])
... z = z.reshape(xx.shape)
... plt.figure()
... plt.pcolormesh(xx, yy, z, cmap=cmap_light)
... plt.scatter(x[:, 0], x[:, 1], c=y, cmap=cmap_bold, edgecolor='k', s=24)
... plt.xlim(xx.min(), xx.max())
... plt.ylim(yy.min(), yy.max())
... plt.titles("3-class classification (k = %i, weights ='%s')" %(n_neighbors, weights))
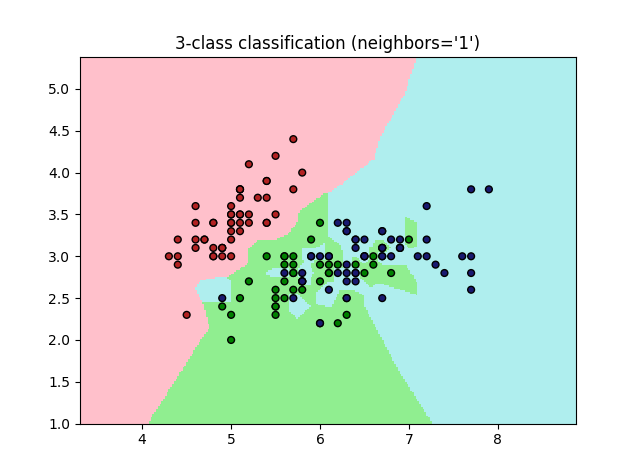
b) Effect of number of neighbors (n_neighbors):
>>> for n_neighbors in [1, 2, 5, 25, 100, 150]:
... clf = neighbors.KNeighborsClassifier(n_neighbors=n_neighbors)
... clf.fit(x, y)
... x_min, x_max = x[:, 0].min() -1, x[:, 0].max() +1
... y_min, y_max = x[:, 1].min() -1, x[:, 1].max() +1
... xx, yy = np.meshgrid(np.arange(x_min, x_max, h), np.arange(y_min, y_max, h))
... z = clf.predict(np.c_[xx.ravel(), yy.ravel()])
... z = z.reshape(xx.shape)
... plt.figure()
... plt.pcolormesh(xx, yy, z, cmap=cmap_light)
... plt.scatter(x[:, 0], x[:, 1], c=y, cmap=cmap_bold, edgecolor='k', s=24)
... plt.xlim(xx.min(), xx.max())
... plt.ylim(yy.min(), yy.max())
... plt.title("3-class classification (neighbors='%s')" %(n_neighbors))
...


 c) Number of jobs (n_jobs):
>>> for n_jobs in [1, 2, 5, 25, 100, 150]:
... clf = neighbors.KNeighborsClassifier(n_jobs=n_jobs)
... clf.fit(x, y)
... x_min, x_max = x[:, 0].min() -1, x[:, 0].max() +1
... y_min, y_max = x[:, 1].min() -1, x[:, 1].max() +1
... xx, yy = np.meshgrid(np.arange(x_min, x_max, h), np.arange(y_min, y_max, h))
... z = clf.predict(np.c_[xx.ravel(), yy.ravel()])
... z = z.reshape(xx.shape)
... plt.figure()
... plt.pcolormesh(xx, yy, z, cmap=cmap_light)
... plt.scatter(x[:, 0], x[:, 1], c=y, cmap=cmap_bold, edgecolor='k', s=24)
... plt.xlim(xx.min(), xx.max())
... plt.ylim(yy.min(), yy.max())
... plt.title("3-class classification (jobs='%s')" %(n_jobs))
...


 d) Effect of leaf size (leaf_size):
>>> for leaf_size in [1, 2, 5, 25, 100, 150]:
... clf = neighbors.KNeighborsClassifier(leaf_size=leaf_size)
... clf.fit(x, y)
... x_min, x_max = x[:, 0].min() -1, x[:, 0].max() +1
... y_min, y_max = x[:, 1].min() -1, x[:, 1].max() +1
... xx, yy = np.meshgrid(np.arange(x_min, x_max, h), np.arange(y_min, y_max, h))
... z = clf.predict(np.c_[xx.ravel(), yy.ravel()])
... z = z.reshape(xx.shape)
... plt.figure()
... plt.pcolormesh(xx, yy, z, cmap=cmap_light)
... plt.scatter(x[:, 0], x[:, 1], c=y, cmap=cmap_bold, edgecolor='k', s=24)
... plt.xlim(xx.min(), xx.max())
... plt.ylim(yy.min(), yy.max())
... plt.title("3-class classification (leaf_size='%s')" %(leaf_size))
...


K Nearest Neighbors Analyses technique is tested here to see their accuracy in terms of output.
Python program:
>>> import numpy as np
>>> import matplotlib.pyplot as plt
>>> from matplotlib.colors import ListedColormap
>>> from sklearn import neighbors, datasets
>>> n_neighbors = 24
>>> iris = datasets.load_iris()
>>> x = iris.data[:, :2]
>>> y = iris.target
>>> h = .02
>>> cmap_bold = ListedColormap(['firebrick', 'lime', 'blue'])
>>> cmap_light = ListedColormap(['pink', 'lightgreen', 'paleturquoise'])
//Plotting the analysis//
a) Effect of weights:
>>> for weights in ['uniform', 'distance']:
... clf = neighbors.KNeighborsClassifier(n_neighbors, weights=weights)
... clf.fit(x, y)
... x_min, x_max = x[:, 0].min() -1, x[:, 0].max() +1
... y_min, y_max = x[:, 1].min() -1, x[:, 1].max() +1
... xx, yy = np.meshgrid(np.arange(x_min, x_max, h), np.arange(y_min, y_max, h))
... z = clf.predict(np.c_[xx.ravel(), yy.ravel()])
... z = z.reshape(xx.shape)
... plt.figure()
... plt.pcolormesh(xx, yy, z, cmap=cmap_light)
... plt.scatter(x[:, 0], x[:, 1], c=y, cmap=cmap_bold, edgecolor='k', s=24)
... plt.xlim(xx.min(), xx.max())
... plt.ylim(yy.min(), yy.max())
... plt.titles("3-class classification (k = %i, weights ='%s')" %(n_neighbors, weights))
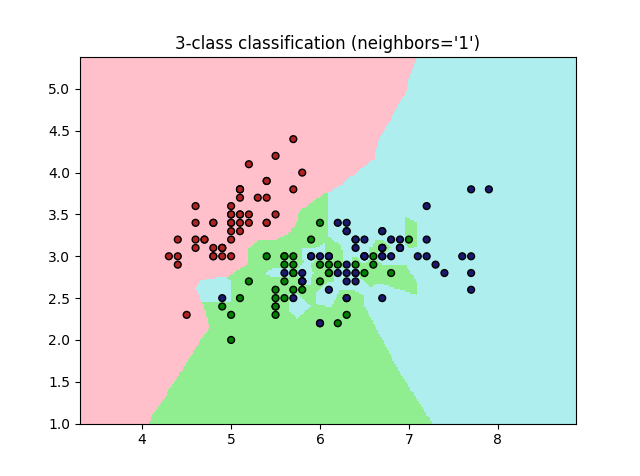
b) Effect of number of neighbors (n_neighbors):
>>> for n_neighbors in [1, 2, 5, 25, 100, 150]:
... clf = neighbors.KNeighborsClassifier(n_neighbors=n_neighbors)
... clf.fit(x, y)
... x_min, x_max = x[:, 0].min() -1, x[:, 0].max() +1
... y_min, y_max = x[:, 1].min() -1, x[:, 1].max() +1
... xx, yy = np.meshgrid(np.arange(x_min, x_max, h), np.arange(y_min, y_max, h))
... z = clf.predict(np.c_[xx.ravel(), yy.ravel()])
... z = z.reshape(xx.shape)
... plt.figure()
... plt.pcolormesh(xx, yy, z, cmap=cmap_light)
... plt.scatter(x[:, 0], x[:, 1], c=y, cmap=cmap_bold, edgecolor='k', s=24)
... plt.xlim(xx.min(), xx.max())
... plt.ylim(yy.min(), yy.max())
... plt.title("3-class classification (neighbors='%s')" %(n_neighbors))
...


>>> for n_jobs in [1, 2, 5, 25, 100, 150]:
... clf = neighbors.KNeighborsClassifier(n_jobs=n_jobs)
... clf.fit(x, y)
... x_min, x_max = x[:, 0].min() -1, x[:, 0].max() +1
... y_min, y_max = x[:, 1].min() -1, x[:, 1].max() +1
... xx, yy = np.meshgrid(np.arange(x_min, x_max, h), np.arange(y_min, y_max, h))
... z = clf.predict(np.c_[xx.ravel(), yy.ravel()])
... z = z.reshape(xx.shape)
... plt.figure()
... plt.pcolormesh(xx, yy, z, cmap=cmap_light)
... plt.scatter(x[:, 0], x[:, 1], c=y, cmap=cmap_bold, edgecolor='k', s=24)
... plt.xlim(xx.min(), xx.max())
... plt.ylim(yy.min(), yy.max())
... plt.title("3-class classification (jobs='%s')" %(n_jobs))
...


>>> for leaf_size in [1, 2, 5, 25, 100, 150]:
... clf = neighbors.KNeighborsClassifier(leaf_size=leaf_size)
... clf.fit(x, y)
... x_min, x_max = x[:, 0].min() -1, x[:, 0].max() +1
... y_min, y_max = x[:, 1].min() -1, x[:, 1].max() +1
... xx, yy = np.meshgrid(np.arange(x_min, x_max, h), np.arange(y_min, y_max, h))
... z = clf.predict(np.c_[xx.ravel(), yy.ravel()])
... z = z.reshape(xx.shape)
... plt.figure()
... plt.pcolormesh(xx, yy, z, cmap=cmap_light)
... plt.scatter(x[:, 0], x[:, 1], c=y, cmap=cmap_bold, edgecolor='k', s=24)
... plt.xlim(xx.min(), xx.max())
... plt.ylim(yy.min(), yy.max())
... plt.title("3-class classification (leaf_size='%s')" %(leaf_size))
...


