Showing posts with label Ensemble Methods. Show all posts

Tuesday, 19 September 2017

Extra Tree Classifier & Effect of parameters

                                                      Extra Trees Classifier

Extra Trees Classifier technique is tested here to see their accuracy in terms of output.

Python program:

>>> import numpy as np
>>> import matplotlib.pyplot as plt
>>> from matplotlib.colors import ListedColormap
>>> from sklearn import ensemble, datasets
>>> iris = datasets.load_iris()
>>> x = iris.data[:, :2]
>>> y = iris.target
>>> h = .02
>>> cmap_bold = ListedColormap(['firebrick', 'lawngreen', 'b'])
>>> cmap_light = ListedColormap(['pink', 'palegreen', 'lightcyan'])

//Plotting the analysis//
>>> for min_samples_leaf in [1, 8, 50, 250]:
...     for n_estimators in [1, 12, 25, 125, 1250]:
...        for n_jobs in [1, 12, 250, 1250, 7200]:
...                for bootstrap in ['True']:
...                    for oob_score in ['False', 'True']:
...                               clf = ensemble.ExtraTreesClassifier(min_samples_leaf=min_samples_leaf, n_estimators=n_estimators, n_jobs=n_jobs, bootstrap=bootstrap, oob_score=oob_score)
...                               clf.fit(x, y)
...                               x_min, x_max = x[:, 0].min() -1, x[:, 0].max() +1
...                               y_min, y_max = x[:, 1].min() -1, x[:, 1].max() +1
...                               xx, yy = np.meshgrid(np.arange(x_min, x_max, h), np.arange(y_min, y_max, h))
...                               z = clf.predict(np.c_[xx.ravel(), yy.ravel()])
...                               z = z.reshape(xx.shape)
...                               plt.figure()
...                               plt.pcolormesh(xx, yy, z, cmap=cmap_light)
...                               plt.scatter(x[:, 0], x[:, 1], c=y, cmap=cmap_bold, edgecolor='k', s=24)
...                               plt.xlim(xx.min(), xx.max())
...                               plt.ylim(yy.min(), yy.max())
...                               plt.title("ExtraTreesClassifier (min_samples_leaf='%s', n_estimators='%s', n_jobs='%s', bootstrap='%s', oob_score='%s')" %(min_samples_leaf, n_estimators, n_jobs, bootstrap, oob_score))
...
Output:
a) Effect of minimum sample leaf at node ends (min_samples_leaf) on output:


We can see that increase in number of value of minimum sample leaf at the nodes result in reduced analyses accuracy.

b) Effect of minimum samples for splitting at leaf nodes(min_samples_split) on output:


 Analysis accuracy decreases as value at min_samples_split increases.

c) Effect of number of estimators(n_estimators) on output:


Increase in number of estimator results in increased Analyses accuracy.


Increase in number of jobs (n_jobs) with higher number of estimators (n_estimators=1250) does not result in improved accuracy.

d) Effect of number of jobs(n_jobs) on output:


Increased number of jobs(n_jobs) may be useful or inconclusive in some cases.


 Increased value of min_samples_leaf result in lowered accuracy of analyses.

Bagging Regression: Effect of parameters

Bagging Regression

 Bagging Regression technique is tested here to see their accuracy in terms of output.

Python program:


>>> import numpy as np
>>> import matplotlib.pyplot as plt
>>> from matplotlib.colors import ListedColormap
>>> from sklearn import ensemble, datasets
>>> iris = datasets.load_iris()
>>> x = iris.data[:, :2]
>>> y = iris.target
>>> h = .02
>>> cmap_bold = ListedColormap(['firebrick', 'lawngreen', 'b'])
>>> cmap_light = ListedColormap(['pink', 'palegreen', 'lightcyan'])

//Plotting the analysis//


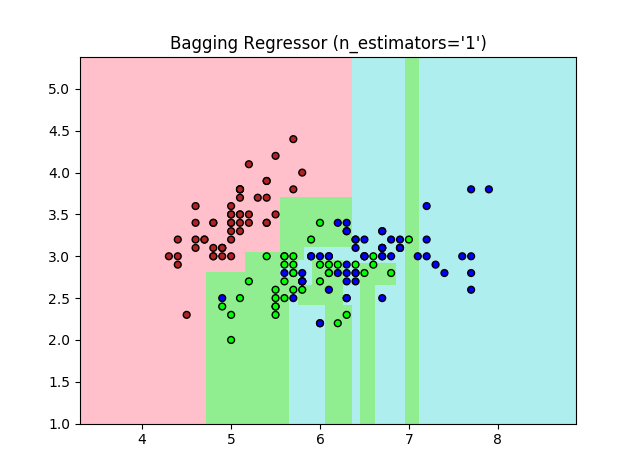
a) Effect of number of estimators(n_estimators):
>>> for n_estimators in [1, 2, 5, 25, 50, 100, 150, 250, 500, 1250]:
...     clf = ensemble.BaggingRegressor(n_estimators=n_estimators)
...     clf.fit(x, y)
...     x_min, x_max = x[:, 0].min() -1, x[:, 0].max() +1
...     y_min, y_max = x[:, 1].min() -1, x[:, 1].max() +1
...     xx, yy = np.meshgrid(np.arange(x_min, x_max, h), np.arange(y_min, y_max, h))
...     z = clf.predict(np.c_[xx.ravel(), yy.ravel()])
...     z = z.reshape(xx.shape)
...     plt.figure()
...     plt.pcolormesh(xx, yy, z, cmap=cmap_light)
...     plt.scatter(x[:, 0], x[:, 1], c=y, cmap=cmap_bold, edgecolor='k', s=24)
...     plt.xlim(xx.min(), xx.max())
...     plt.ylim(yy.min(), yy.max())
...     plt.title("Bagging Regressor (n_estimators='%s')" %(n_estimator))

Output:


Increased number of estimators result in improved output accuracy.

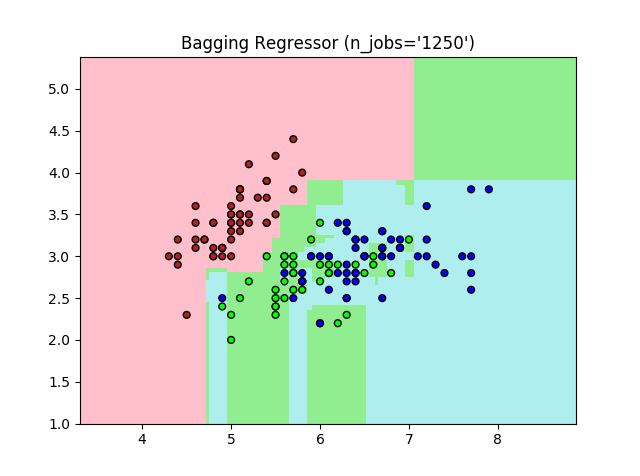
b) Effect of number of jobs (n_jobs):

>>> for n_jobs in [1, 2, 5, 25, 50, 100, 150, 250, 500, 1250]:
...     clf = ensemble.BaggingRegressor(n_jobs=n_jobs)
...     clf.fit(x, y)
...     x_min, x_max = x[:, 0].min() -1, x[:, 0].max() +1
...     y_min, y_max = x[:, 1].min() -1, x[:, 1].max() +1
...     xx, yy = np.meshgrid(np.arange(x_min, x_max, h), np.arange(y_min, y_max, h))
...     z = clf.predict(np.c_[xx.ravel(), yy.ravel()])
...     z = z.reshape(xx.shape)
...     plt.figure()
...     plt.pcolormesh(xx, yy, z, cmap=cmap_light)
...     plt.scatter(x[:, 0], x[:, 1], c=y, cmap=cmap_bold, edgecolor='k', s=24)
...     plt.xlim(xx.min(), xx.max())
...     plt.ylim(yy.min(), yy.max())
...     plt.title("Bagging Regressor (n_jobs='%s')" %(n_jobs))

Increased number of jobs(n_jobs) result in improved analyses accuracy.

c) Effect of maximum sample size:

>>> for max_samples in [1, 2, 5, 25, 50, 100, 120, 150]:
...     clf = ensemble.BaggingRegressor(max_samples=max_samples)
...     clf.fit(x, y)
...     x_min, x_max = x[:, 0].min() -1, x[:, 0].max() +1
...     y_min, y_max = x[:, 1].min() -1, x[:, 1].max() +1
...     xx, yy = np.meshgrid(np.arange(x_min, x_max, h), np.arange(y_min, y_max, h))
...     z = clf.predict(np.c_[xx.ravel(), yy.ravel()])
...     z = z.reshape(xx.shape)
...     plt.figure()
...     plt.pcolormesh(xx, yy, z, cmap=cmap_light)
...     plt.scatter(x[:, 0], x[:, 1], c=y, cmap=cmap_bold, edgecolor='k', s=24)
...     plt.xlim(xx.min(), xx.max())
...     plt.ylim(yy.min(), yy.max())
...     plt.title("Bagging Regressor (n_estimators='%s')" %(n_estimators))
...     plt.title("Bagging Regressor (max_samples='%s')" %(max_samples))
...

Increased number of max_samples result in increased output accuracy.

d) Effect of Bootstrap on output:

>>> for bootstrap_features in [True, False]:
...     clf = ensemble.BaggingRegressor(bootstrap_features=bootstrap_features)
...     clf.fit(x, y)
...     x_min, x_max = x[:, 0].min() -1, x[:, 0].max() +1
...     y_min, y_max = x[:, 1].min() -1, x[:, 1].max() +1
...     xx, yy = np.meshgrid(np.arange(x_min, x_max, h), np.arange(y_min, y_max, h))
...     z = clf.predict(np.c_[xx.ravel(), yy.ravel()])
...     z = z.reshape(xx.shape)
...     plt.figure()
...     plt.pcolormesh(xx, yy, z, cmap=cmap_light)
...     plt.scatter(x[:, 0], x[:, 1], c=y, cmap=cmap_bold, edgecolor='k', s=24)
...     plt.xlim(xx.min(), xx.max())
...     plt.ylim(yy.min(), yy.max())
...     plt.title("Bagging Regressor (bootstrap_features='%s')" %(bootstrap_features))
...
Change in status of bootstrap_features from False to True result in improved accuracy.

e) Effect of out of bound:
>>> for oob_score in [True, False]:
...     clf = ensemble.BaggingRegressor(oob_score=oob_score)
...     clf.fit(x, y)
...     x_min, x_max = x[:, 0].min() -1, x[:, 0].max() +1
...     y_min, y_max = x[:, 1].min() -1, x[:, 1].max() +1
...     xx, yy = np.meshgrid(np.arange(x_min, x_max, h), np.arange(y_min, y_max, h))
...     z = clf.predict(np.c_[xx.ravel(), yy.ravel()])
...     z = z.reshape(xx.shape)
...     plt.figure()
...     plt.pcolormesh(xx, yy, z, cmap=cmap_light)
...     plt.scatter(x[:, 0], x[:, 1], c=y, cmap=cmap_bold, edgecolor='k', s=24)
...     plt.xlim(xx.min(), xx.max())
...     plt.ylim(yy.min(), yy.max())
...     plt.title("Bagging Regressor (oob_score='%s')" %(oob_score))
...
Change in status of oob from False to True result in improved accuracy.

f) Effect of number of features:
>>> for max_features in [1, 2]:
...     clf = ensemble.BaggingRegressor(max_features=max_features)
...     clf.fit(x, y)
...     x_min, x_max = x[:, 0].min() -1, x[:, 0].max() +1
...     y_min, y_max = x[:, 1].min() -1, x[:, 1].max() +1
...     xx, yy = np.meshgrid(np.arange(x_min, x_max, h), np.arange(y_min, y_max, h))
...     z = clf.predict(np.c_[xx.ravel(), yy.ravel()])
...     z = z.reshape(xx.shape)
...     plt.figure()
...     plt.pcolormesh(xx, yy, z, cmap=cmap_light)
...     plt.scatter(x[:, 0], x[:, 1], c=y, cmap=cmap_bold, edgecolor='k', s=24)
...     plt.xlim(xx.min(), xx.max())
...     plt.ylim(yy.min(), yy.max())
...     plt.title("Bagging Regressor (max_features='%s')" %(max_features))
...

Increase in features result in improved accuracy.

Bagging Classifier: Effect of parameters

Bagging Classifier

Bagging Classifier technique is tested here to see their accuracy in terms of output.

Python program:


>>> import numpy as np
>>> import matplotlib.pyplot as plt
>>> from matplotlib.colors import ListedColormap
>>> from sklearn import ensemble, datasets
>>> iris = datasets.load_iris()
>>> x = iris.data[:, :2]
>>> y = iris.target
>>> h = .02
>>> cmap_bold = ListedColormap(['firebrick', 'lawngreen', 'b'])
>>> cmap_light = ListedColormap(['pink', 'palegreen', 'lightcyan'])


//Plotting the analysis//

a) Effect of maximum samples (max_samples):
>>> for max_samples in [2, 5, 10, 25, 50, 100, 125]:
...     clf = ensemble.BaggingClassifier(max_samples=max_samples)
...     clf.fit(x, y)
...     x_min, x_max = x[:, 0].min() -1, x[:, 0].max() +1
...     y_min, y_max = x[:, 1].min() -1, x[:, 1].max() +1
...     xx, yy = np.meshgrid(np.arange(x_min, x_max, h), np.arange(y_min, y_max, h))
...     z = clf.predict(np.c_[xx.ravel(), yy.ravel()])
...     z = z.reshape(xx.shape)
...     plt.figure()
...     plt.pcolormesh(xx, yy, z, cmap=cmap_light)
...     plt.scatter(x[:, 0], x[:, 1], c=y, cmap=cmap_bold, edgecolor='k', s=24)
...     plt.xlim(xx.min(), xx.max())
...     plt.ylim(yy.min(), yy.max())
...     plt.title("Bagging Classifier (max_samples='%s')" %(max_samples))
...


Increase in maximum samples value (max_samples) result in increased output accuracy.

b) Effect of number of jobs (n_jobs):
>>> for n_jobs in [150, 250, 500, 2500, 5000, 10000, 13500]:
...     clf = ensemble.BaggingClassifier(n_jobs=n_jobs)
...     clf.fit(x, y)
...     x_min, x_max = x[:, 0].min() -1, x[:, 0].max() +1
...     y_min, y_max = x[:, 1].min() -1, x[:, 1].max() +1
...     xx, yy = np.meshgrid(np.arange(x_min, x_max, h), np.arange(y_min, y_max, h))
...     z = clf.predict(np.c_[xx.ravel(), yy.ravel()])
...     z = z.reshape(xx.shape)
...     plt.figure()
...     plt.pcolormesh(xx, yy, z, cmap=cmap_light)
...     plt.scatter(x[:, 0], x[:, 1], c=y, cmap=cmap_bold, edgecolor='k', s=24)
...     plt.xlim(xx.min(), xx.max())
...     plt.ylim(yy.min(), yy.max())
...     plt.title("Bagging Classifier (n_jobs='%s')" %(n_jobs))
...
Increased number of jobs result in decreased output accuracy.

c) Effect of random state (random_state):
>>> for random_state in [250,500, 1250, 3500, 5700, 12500]:
...     clf = ensemble.BaggingClassifier(random_state=random_state)
...     clf.fit(x, y)
...     x_min, x_max = x[:, 0].min() -1, x[:, 0].max() +1
...     y_min, y_max = x[:, 1].min() -1, x[:, 1].max() +1
...     xx, yy = np.meshgrid(np.arange(x_min, x_max, h), np.arange(y_min, y_max, h))
...     z = clf.predict(np.c_[xx.ravel(), yy.ravel()])
...     z = z.reshape(xx.shape)
...     plt.figure()
...     plt.pcolormesh(xx, yy, z, cmap=cmap_light)
...     plt.scatter(x[:, 0], x[:, 1], c=y, cmap=cmap_bold, edgecolor='k', s=24)
...     plt.xlim(xx.min(), xx.max())
...     plt.ylim(yy.min(), yy.max())
...     plt.title("Bagging Classifier (random_state='%s')" %(random_state))
...


Increased number of estimators result in decreased output accuracy.

d) Effect of number of estimators (n_estimators):
>>> for n_estimators in [1, 2, 5, 25, 50, 100, 150, 250, 500, 1250]:
...     clf = ensemble.BaggingClassifier(n_estimators=n_estimators)
...     clf.fit(x, y)
...     x_min, x_max = x[:, 0].min() -1, x[:, 0].max() +1
...     y_min, y_max = x[:, 1].min() -1, x[:, 1].max() +1
...     xx, yy = np.meshgrid(np.arange(x_min, x_max, h), np.arange(y_min, y_max, h))
...     z = clf.predict(np.c_[xx.ravel(), yy.ravel()])
...     z = z.reshape(xx.shape)
...     plt.figure()
...     plt.pcolormesh(xx, yy, z, cmap=cmap_light)
...     plt.scatter(x[:, 0], x[:, 1], c=y, cmap=cmap_bold, edgecolor='k', s=24)
...     plt.xlim(xx.min(), xx.max())
...     plt.ylim(yy.min(), yy.max())
...     plt.title("Bagging Classifier (n_estimators='%s')" %(n_estimators))
...


Increased number of estimators result in improved output accuracy.